 Jupiter Faucet
Understanding Crypto Candlestick Patterns: A Comprehensive Guide
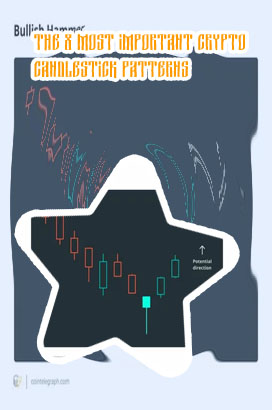
Top 10 Most Common Crypto Candlestick Patterns Every Trader Should Know
Candlestick patterns are essential tools for traders in the cryptocurrency market as they provide valuable insights into price movements. Understanding these patterns can help traders make informed decisions and improve their trading strategies. In this article, we will discuss the top 10 most common crypto candlestick patterns that every trader should know.
-
Doji: A doji occurs when the opening and closing prices are almost the same, indicating indecision in the market.
-
Hammer: A hammer is a bullish reversal pattern that signals a potential price reversal to the upside.
-
Shooting Star: The shooting star is a bearish reversal pattern that indicates a potential price reversal to the downside.
-
Engulfing Pattern: The engulfing pattern consists of two candles, where the second candle completely engulfs the first one, signaling a potential reversal in the market.
-
Morning Star: The morning star is a bullish reversal pattern that consists of three candles and indicates a potential price reversal to the upside.
-
Evening Star: The evening star is a bearish reversal pattern that consists of three candles and signals a potential price reversal to the downside.
-
Bullish Harami: The bullish harami is a bullish reversal pattern that consists of two candles, where the second candle is smaller than the
How to Use Crypto Candlestick Patterns to Make Informed Trading Decisions
Cryptocurrency trading can be a highly volatile and risky endeavor, but understanding how to interpret candlestick patterns can help traders make more informed decisions. These patterns, which display the price movement of a cryptocurrency over a certain period of time, can provide valuable insights into market trends and potential price movements.
By learning how to recognize and interpret these patterns, traders can gain a better understanding of market sentiment and make more educated predictions about future price movements. For example, a bullish engulfing pattern, where a small red candle is followed by a larger green candle, could indicate a potential reversal in a downtrend.
Additionally, understanding candlestick patterns can help traders identify key levels of support and resistance, which can be used to set entry and exit points for trades. By combining these patterns with other technical analysis tools, such as moving averages and trend lines, traders can develop a more comprehensive trading strategy.
In conclusion, mastering the art of reading crypto candlestick patterns is essential for making informed trading decisions in the cryptocurrency market. By understanding these patterns and using them to analyze price movements, traders can increase their chances of success and minimize their risks.
Advanced Strategies for Analyzing Crypto Candlestick Patterns and Predicting Price Movements
One key tool in a trader's <a href"/bombcrypto-12">Bombcrypto arsenal is the analysis of candlestick patterns.